Marine weather online
The Marine weather and the Baltic Sea section has observations and forecasts for the sea. A subpage of the Marine weather map service has more detailed information on observations and forecasts of different variables.
Marine Weather
The purpose of the Marine Weather chart is to supply information on a chart template on prevailing conditions intended specifically for travel at sea.
Buttons on the left side can be used for zooming the chart in or out, centring the chart on the location of the viewer's own device, showing harbours and lighthouses on the chart, and looking at the colour coding of variables related to the weather and the sea.
The visible variables are selected by using the buttons on the right side. The buttons are: wind speed, air temperature, visibility, and the sea water level, as well as waves, precipitation, air pressure, water temperature, and sea ice.
Observations and forecasts on these variables are shown to the measuring stations of the Finnish Meteorological Institute, which include coastal and lake weather stations, wave buoys, temperature buoys, and mareographs. The chart also has places for which no observations are available, on lakes, for example. Clicking on a station point brings a time series window into view. The time series window can be closed by clicking on the x in the upper right-hand corner. Precipitation is observed by weather radar in past until current time and in to the future it is a precipitation forecasts. If the lightning location sensor network has observed thunder, the lightning strikes are also shown on the chart. The percentage of the surface area of the sea that is covered by ice is shown. On the lower edge of the chart there is a timeline bar with an arrow that indicates the point in time shown on the chart. Clicking the repeat button on the left side of the timeline animates the picture on the chart.
Only one of the buttons of the upper view (wind speed, air temperature, visibility, and sea level) can be selected at the same time.
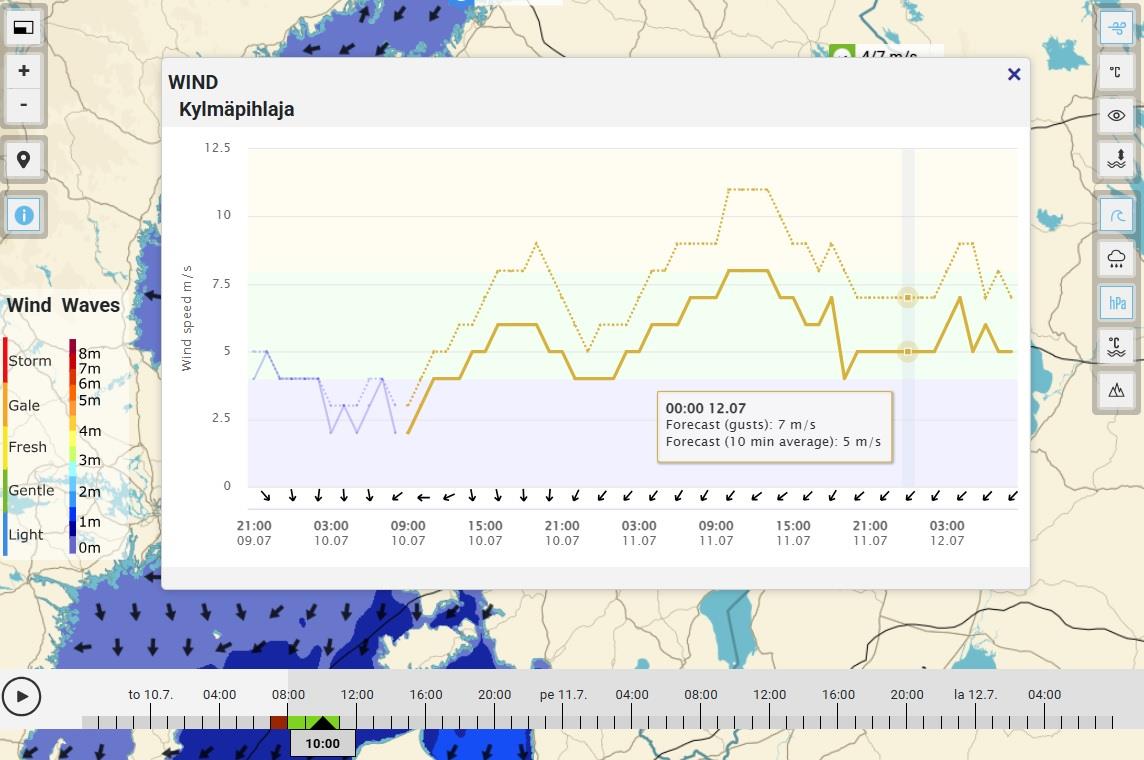
Wind and air pressure forecast
The animation shows the forecast for wind speed (m/s), wind direction, and atmospheric pressure (hPa) for the upcoming two days. The forecast for the speed of the wind indicates the average wind in open wind conditions blowing for ten minutes at an altitude of 10 metres. The wind speed can be considerably higher in gusts and for that reason, the wind speed readings can deviate from prevailing wind warnings. The forecast shown in the animation is the same as the forecast on the Marine weather chart. Observations cannot be seen in the forecasts for wind and atmospheric pressure. Before going out to sea, it is a good idea to check the prevailing warnings and weather forecast for shipping.
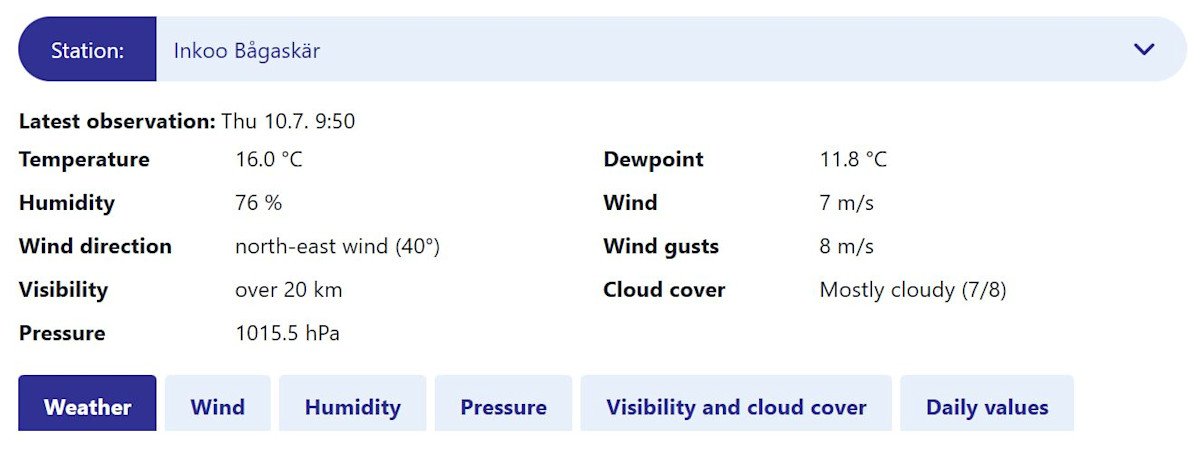
Marine weather observations
The Marine weather observations page has weather observations from the Finnish Meteorological Institutes weather stations on the coasts and on lakes. The weather station is selected from the drop-down menu. The reported variables of observations vary from one station to another according to the information that is measured at the station. The frequency of updates varies, but it happens mostly at 10-minute intervals.
The observation stations report on some of the following variables:
temperature
atmospheric pressure
relative humidity
dew point temperature
wind direction and speed (average speed over 10 minutes
wind gust value (strongest 3-second gust)
precipitation in the past hour
snow depth
cloudiness
visibility
For example, the openness of the observation station has a strong effect on measuring wind speed. Some stations in some sectors can have obstacles that cause a wind reading that is observed to differ from the wind blowing in an adjacent sea area.
The observation curves below work in the same way that the observation curves for local weather. Their operations are described on the page Weather services on the Internet.
Sea level
The page has observations and forecasts on the sea level at fourteen locations for measurement. The observation station map is in the lower part of the page. The sea level is presented according to two different height systems: the N2000 system (=BSCD2000), and the theoretical mean water. The unit is the centimetre (cm).
The measuring station and the type of graph to be shown is selected from the drop-down menu above the graph. You can click the keys below the graph to turn variables on and off. The numerical value of the sea level and the time can be seen on most devices by placing the mouse pointer over the graph. The horizontal axis shows only the time on some graphs. All the time information, including the date, can be seen by placing the pointer on top of the graph as mentioned above. The background colour of the graph is grey for every second day (00:00 - 24:00) and white for each alternating day.
If there is no observation (due to a technical problem, etc.) and the value has been calculated from the next mareographs´ observations, there is an exclamation mark (!) after the number.

Graph options
2+2 days (default): The observed sea level and the sea level that is forecast for the station. The observations are updated every 10 minutes. The forecast is updated four times a day and extends two days ahead.
Probability forecast: The sea level forecast for the next 10 days. The forecast is based on an ensemble forecast for wind and atmospheric pressure produced by the European Centre for Medium-Range Weather Forecasts (ECMWF). These are used for calculating expected variation in sea levels. The forecast intervals that are depicted in the graph show the percentage of different forecasts of an ensemble forecast (50 % and 80 %) that is within the margin of fluctuation in the sea level. The median is the most common, that is to say, the most likely value of the ensemble forecast. The probability forecast is updated twice a day. Probability forecasts are suited for use in forecasts of a duration longer than two days. For shorter forecast periods, the 2 + 2-day forecast is better.
Observations 14 days, 3 months, and 12 months: Sea levels observed at measuring stations in the previous 14 days, 3 months, and 12 months. The bottom of the column in the bar diagram gives the lowest sea level observed in one day, and the upper edge gives the highest sea level observed during the day.
Table
The lower part of the Sea level at measurement site diagram shows the latest sea level observations of each station. The time of the observation is shown on the upper edge of the diagram.
Wave height and wave forecast
The waves are measured with wave buoys whose locations are shown on the chart and listed. Wave height is usually reported as a significant wave height, but also other parameters are measured. The observations are updated every ½ hour or 1 hour. In the winter the buoys are taken out of the sea because of the ice.
The graph includes observations of significant wave height over 7 days in blue line, and a 3-day forecast in a red dash line. The arrows below indicate the direction of the waves. By setting mouse on the graph, the precise wave height and direction of that time can be seen in a tooltip. The station is selected from the upper part and can be one of the wave buoys. On a narrow screen, the graph can be rolled sideways.
The most recent observations from the wave buoys can be seen in the diagram. In addition to the significant wave height the diagram also gives the highest wave, the direction that waves are coming from as degrees and a period in seconds. Water temperature measured by the wave buoy (°C) is also indicated. If the observations are lacking, the table presents the first value of the wave model in brackets.
The wave forecast charts show the predicted significant wave height and the direction of the waves with arrows. Blue is for the lowest and red is for the highest waves. The area can be the entire Baltic Sea or the Archipelago Sea.
Ice conditions
Ice conditions in the Baltic Sea, chart as PDF file
The ice chart indicates the prevailing ice situation in the Baltic Sea. In addition, the chart has information on matters including the sea surface temperature, icebreakers in operation, and restrictions on assistance to ports. The chart opens in PDF form from links on the upper part of the page in colour and in black and white.
The publication of the chart takes place on Mondays and Thursdays starting in the autumn. When the amount of ice increases, the chart will switch to daily publication and stay that way until the last of the ice is melted. The newest chart is made public by 14:15.

Simplified ice chart and comparative charts
The ice situation can be compared on charts that can be accessed by the ice chart links. The first is a simplified version of an ice chart of the Baltic Sea from the previous Monday, showing areas near Finland. It´s updated weekly, at latest on Tuesday morning. For the second chart there is a choice of one of four options from these titles:
Normal situation (default): Average ice situation for the time, defined by the years 2008–2022. The situation is a median of a 10-days period, 1st–10th, 11th–20th or 21st–the last day of the month.
Previous ice chart: Simplified chart from a week ago.
Ice chart from the previous year: Chart from a year ago.
Icebreakers: Simplified ice chart in which icebreakers in operation are also shown.
The ice extent graph
Daily ice extent on the Baltic Sea (km²) based on the ice charts.
Lightblue envelope curves (min–max): the largest and smallest ice extents of the ice seasons 2007–2021.
Dark blue envelope curve (25 %–75 %): fractiles of the ice extent.
Green line (50 %): the median extent of the seasons 2007–2021
Black dotted line: the previous season's ice extent
Solid black line: the current ice season's extent.
The values are rounded so that areas less than 100 km² are with a precision of 10 km², from hundred to thousand square kilometres with 100 km² precision and larger areas with a precision of 1,000 km².
8.5.2026