Sea level height systems in Finland
When talking about sea level it is essential to know in which height system the values are given. In other words, to what level the zero of the scale of measurement has been set. There are many options for this and below are the ones that are most used in Finland.
Theoretical mean water, MW
Theoretical mean water, also known as theoretical mean sea level (MSL), is an estimate for the long-term expectation value of sea level, made for practical purposes. Land uplift, global sea level rise, as well as changes in the Baltic Sea water balance are taken into account. Because of these changes, the theoretical mean sea level is not a constant. The rate of change of the theoretical mean sea level from year to year is not constant either, due to changing rate of the global sea level rise and changes in the Baltic Sea water balance. The Finnish Meteorological Institute confirms the height of the theoretical mean sea level annually, using the most recent knowledge on the past and future changes of the factors affecting the sea level.
The theoretical mean sea level has been commonly used in Finland as a reference level when sea level information is given for instance on the internet, radio and in the newspapers. Also depth data in nautical charts have been given in relation to the theoretical mean sea level. Since 2021 data has been also given commonly in N2000-system.
N2000
The height system N2000 is based on the Third Levelling of Finland (1978–2006). It is a Finnish realization of the common European height system, and its datum is derived from NAP (Normaal Amsterdams Peil). The countries around the Baltic Sea use a collective name of the system, which is Baltic Sea Chart Datum 2000, or abbreviation BSCD2000. It is the same as the N2000 height system in Finland.The heights of N2000 differ 13–43 cm from the heights of the previous Finnish national height system N60. Most of the difference is due to the land uplift during 40 years: the N2000 heights are corrected for vertical motion to the epoch 2000, and those of N60 to 1960. There are also differences in the computation methods.
Transitioning to the N2000 height system
Until autumn 2021 the Finnish Meteorological Institute stated the sea level values primarily in relation to the theoretical mean sea level. One of the biggest reasons for this practice has been that also the depth data of nautical charts has been stated in relation to the theoretical mean water. Now the height system of the nautical charts is switched over to the N2000 (=BSCD2000) height system. The change happens area by area and it is executed by Finnish Transport and Communications Agency (Traficom). The first nautical charts with N2000 height system were published in 2021 from the Bay of Bothnia. It has been estimated that all of the nautical charts of the Finnish sea areas will be switched to N2000 in about 6 years from that so the last charts from the eastern Gulf of Finland would be in N2000 system in 2026. Because of this change, sea level observations and forecasts are offered widely in the N2000 height system too.
Information on the renewal of the nautical charts from Traficom.
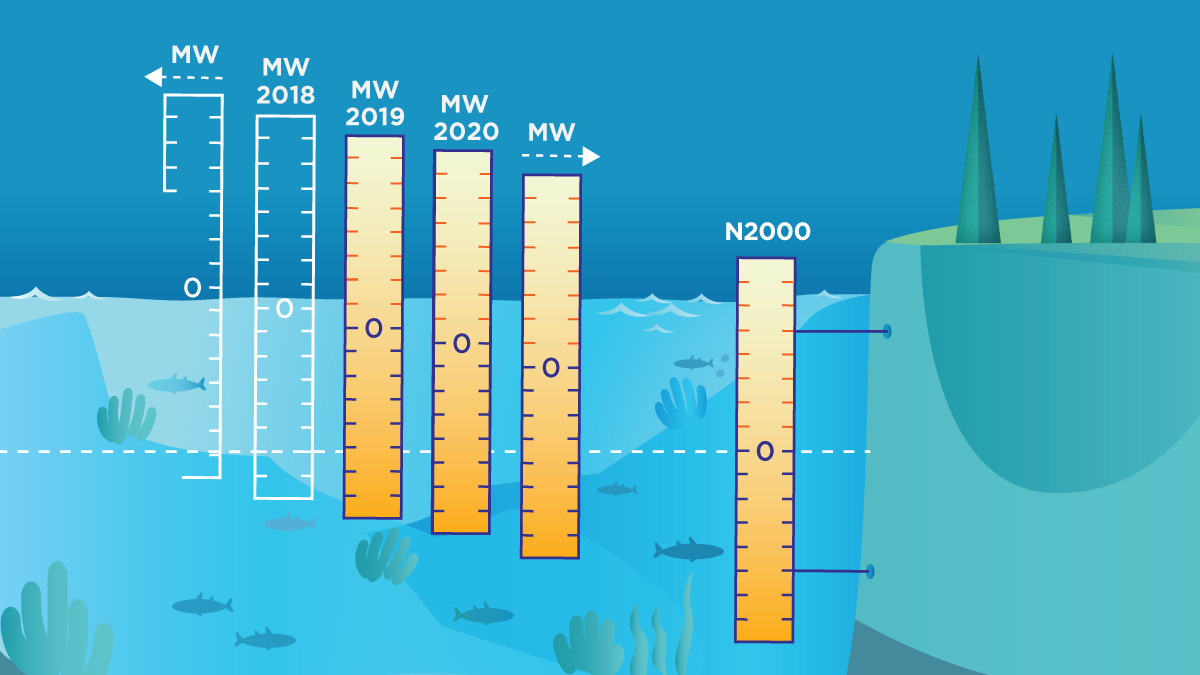
Theoretical mean water and N2000
Differences between the theoretical mean water and N2000 sea levels.
Theoretical mean water (MW or MSL)
Zero level is approximately the average sea level of a year.
More precise, it´s the expected value.
Zero level changes yearly because of
land uplift
global sea level rise
Main system until 2021
N2000 (= BSCD2000)
Zero level doesn´t change.
Available in most of sea level products since September 2021.
Older geodetic height systems in Finland
NN
The first high-precision levelling in Finland was carried out in 1892–1910, resulting in the height system NN. However, it did not correspond to the geoid as accurately as N60. The zero level for NN was defined to be the zero point of a water level scale situated at Katajanokka, Helsinki. It was 30.465 meters below the main benchmark of Finland, located near the Astronomical Observatory in Helsinki.
N43
The second high-precision levelling in Finland was carried out in 1935–1975. The height system N43 vas defined based on the results of the years 1935–1955. In defining this height system, the whole levelling network was not used. Land uplift during the measurement period was not taken into account either.
N60
The height system N60 was calculated based on the two earlier high-precision levellings after the second one was completed. The land uplift was also taken into account. Thus, N60 is considered to correspond to the geoid more accurately than the previous systems, NN or N43.
Conversion tables
Annual theoretical mean sea level values on the Finnish coast referenced to the geodetic height systems (N2000, N60, N43 and NN) are given in the tables on a subpage Sea level height systems conversions.
27.4.2026