Sea ice statistics
The Ice Service monitors the ice situation in the Baltic Sea and publishes daily ice charts and ice reports. Observations for these are collected from satellite images, icebreaker reports and coastal observation station data.
Maximum extent of sea ice
The maximum ice extent of the Baltic Sea on winters 1991–2020 varied from 37 000 km² to 309 000 km². The average maximum of the 30-year period is 141,000 km². The sea-ice extent, calculated from the ice charts, is indicated to the nearest thousand square kilometres. The area of the ice extent indicates sea surface where at least 1/10 is covered by ice. The total area of the Baltic Sea is 420,000 km².
Freezing and ice break-up dates
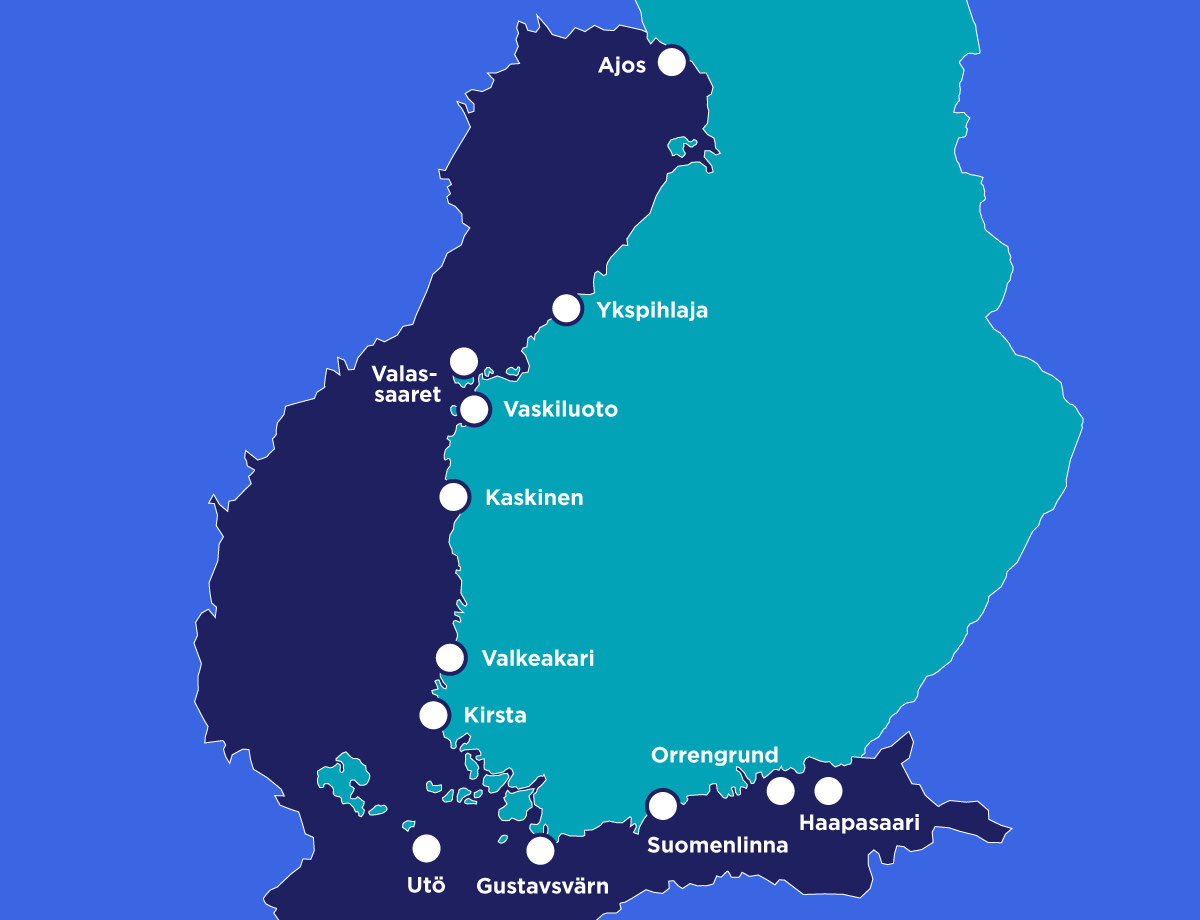
The dates of sea-ice freezing and ice break-up 1991–2020, the so-called AE figures. The dates were calculated at 12 locations on the Finnish coast based on the Baltic Sea ice chart. Select the place from the menu.
Permanent ice cover (B, C) refers to a period when ice with a minimum coverage of 5/10 is present in the area for at least five days. Periods of maximum four days on which there is no ice or the coverage is less than 5/10 are permitted. If more than one period that meets the definition of permanent ice cover occurs during the winter, the longest one is selected. Real ice days (E) are days when ice with a minimum coverage of 1/10 was present in the area.
21.1.2026