Utö observations
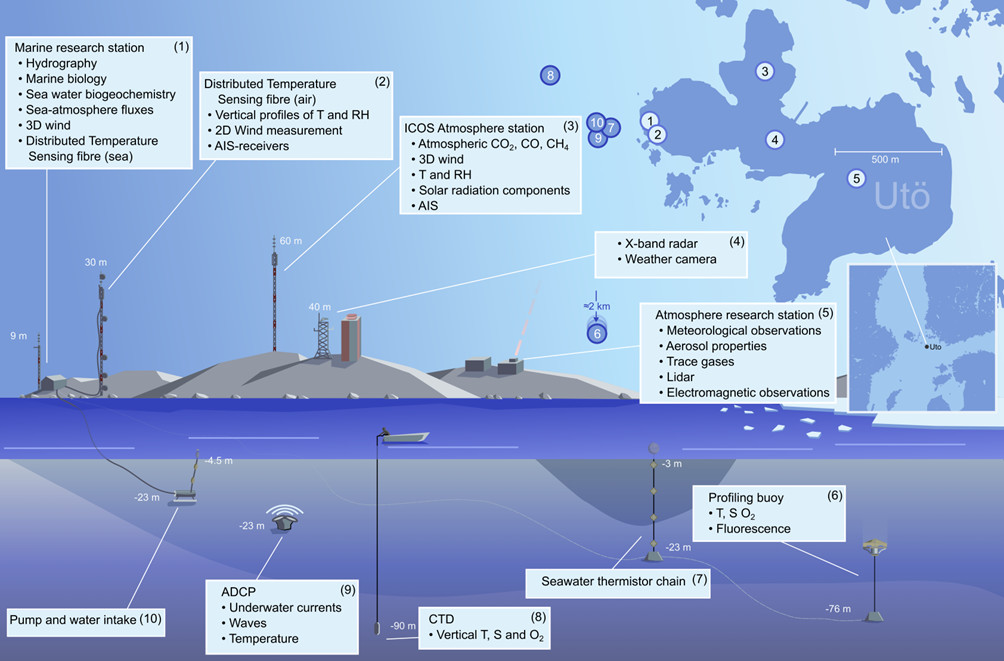
Observations at Utö Atmospheric and Marine Research Station
Links for real-time observations at Utö:
Online marine and meteorological data from Utö Online marine data from VOS Silja Serenade (operating between Helsinki, Mariehamn and Stockholm; route approximately 10 km south of Utö). Data not available during the period with sea ice (typically December - February)
Meteorological observations
Skip Utö observations91 table
Variable | Start of measurements | Institute |
T, p, WS, WD, RH | 1881 | FMI |
Precipitation | 1881 | FMI |
Global radiation | 1998 | FMI |
Diffuse radiation | 1998 | FMI |
UV-radiation | 1998 | FMI |
Visibility | 2002 | FMI |
Cloud cover and height | 2006 | FMI |
Wind profile (Doppler lidar) | 2012 | FMI |
Weather camera | 2014 | FMI |
Solar radiation spectra | 2017 | SYKE |
Sunphotometer | 2017 | FMI |
Solar energy production | 2025 | FMI |
Aerosol and trace gas observations
Skip Utö observations92 table
Variable | Start of measurements | Institute |
Aerosol chemical composition (PM10) | 1980 koe | FMI |
SO2 | 1980 | FMI |
NO2 | 1986 | FMI |
O3 | 1986 | FMI |
VOC | 1994-2008 | FMI |
Fine particles (PM2.5) | 2003 | FMI |
Aerosol size distribution | 2004 | FMI |
Aerosol absorption | 2007 | FMI |
Aerosol scattering | 2010 | FMI |
Aerosol chemical composition (PM2.5) | 2011 | FMI |
Phosphorus deposition | 2014 | FMI |
Radon | 2015 | FMI |
Aerosol Optical Depth | 2016 | FMI |
Greenhouse gas observations
(See also: ICOS-Utö)
Skip Utö observations93 table
Variable | Start of measurements | Institute |
CO2, CH4 and CO concentrations | 2012 | FMI |
CO2- flux | 2016 | FMI |
pCO2 | 2016 | FMI |
pH (sea water) | 2016 | SYKE |
Marine observations
Skip Utö observations94 table
Variable | Start of measurements | Institute |
Sea ice observations | 1897 | FMI (/FIMR) |
Temperature and salinity profiling 0-90m | 1900 | FMI (/FIMR) |
Nutrients and chlorophyll | 2001 | ELY (Centre for Economic Development, |
Wave buoy & SST | 2012-2014, 2023 - | FMI |
Sea Ice radar | 2013 | FMI |
T-S-O2-profiles (0...-80m) | 2013 | FMI |
Temperature, salinity, O2, turbidity, chlorophyll (at 5 m depth) | 2014 | FMI |
Currents (0...-23m) and surface waves | 2014 - 2025 | FMI |
AIS receiver | 2015 | FMI |
Bottle sampler | 2015 | SYKE |
Chlorophyll, temperature, salinity, phycoscyanin, turbidity, phytoplankton species composition etc (flow-through) | 2016 | SYKE |
Vertical profiles of temperature, salinity, O2, turbidity, chlorophyll, cyanobacteria (0...-76m) | 2018 | FMI and SYKE |
Currents (0...-76m) and surface waves | 2018 | FMI |
Phytoplankton species composition (real-time) | 2017 | SYKE |
Electromagnetic observations
Skip Uto_electromagnetic table
Variable | Start of measurements | Institute |
X-band radar | 2014 | FMI |
Refractivity profiles | 2021 | FMI |
AIS profiles | 2022 | FMI |
ADS-B | 2024 | FMI |
SDR (ETTUS) | 2025 | FMI |