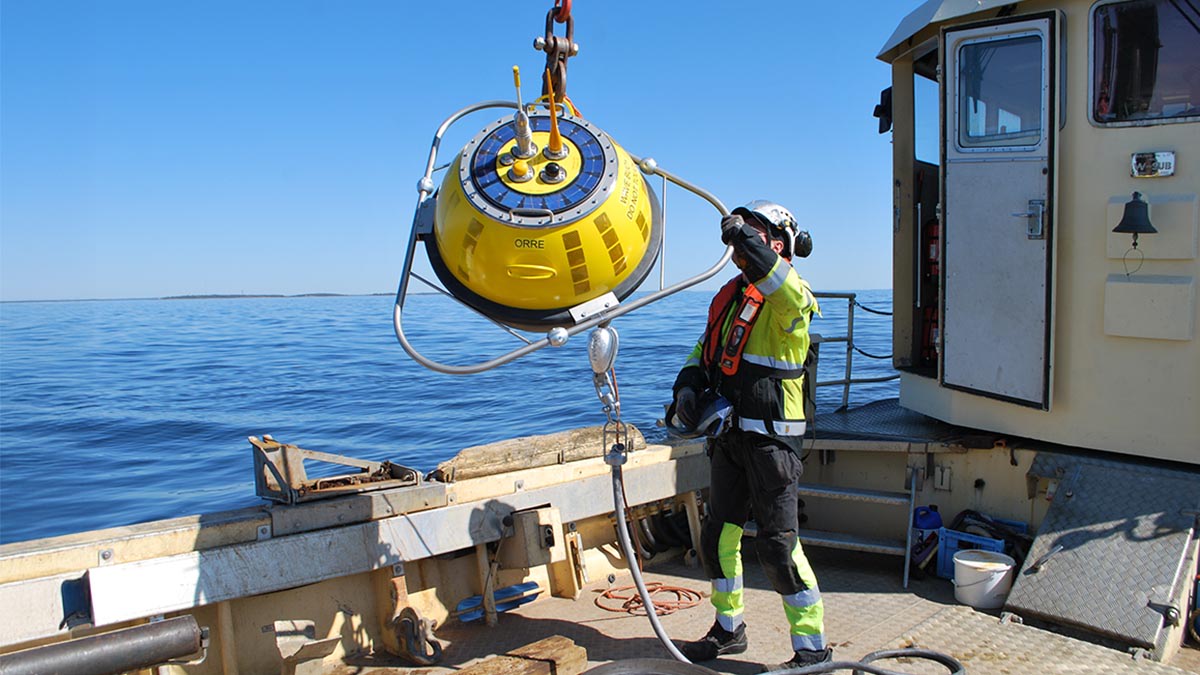
New wave buoys in the Baltic Sea

Our wave observation network has expanded and there is now also wave information available from Kemi, Utö and Orrengrund. During the summer, new wave buoys were installed in the Kemi sea area near the Kemi 2 radar mark and Nukkujanmatala and in Loviisa near the island of Orrengrund. Also, the previously installed Utö's wave buoy make the wave measurement network more complete. The buoy is located south of the island of Utö in Parainen, near the islands of Svartbådarna.
The buoys measure the wave height, direction and period, as well as the sea water temperature. The significant wave height and the highest waves are calculated from observations. Since the waves is composed of waves of very different heights, significant wave height is the most practical way to describe the height of the entire wave. The highest single wave is usually nearly twice the significant wave height.
All wave buoys measure seawater temperature too. The Finnish Meteorological Institute also has buoys that measure seawater temperature only.
The wave buoys are
Kemi
Bay of Bothnia
Bothnian Sea
Northern Baltic Sea
Parainen Utö Svartbådarna
Helsinki Suomenlinna
Gulf of Finland
Loviisa Orrengrund
Winter break
The buoys cannot withstand ice, so they are picked up from the sea before the ice comes and returned after the ice has left. That´s why there are no data available from all buoys during the winter and, for example, the highest waves of winter storms may have remained unmeasured.
For safe and seamless shipping
Wave data is significant especially for shipping and boaters. For pilot’s work, the wave height is very important. It is also important for boaters to check the wave forecast and plan the boat trip according to that. From the buoy observations one can see the present wave height in different parts of the Baltic Sea. The buoy observations are also an essential part of the development of wave forecasts. The more observations, the better forecasting model can be done.
The latest buoys in Kemi and Orrengrund have been purchased and installed in cooperation with the Finnish Transport Infrastructure Agency. The authorities cooperate in many ways to ensure seamless and safe shipping in Finnish sea areas.
Where are the buoy observations found?
Wave observations are calculated from a 30-minute measurement period, so a new observation is obtained every half-hour. The observations of the last days are shown in the graphs on the Finnish Meteorological Institute's webpage https://en.ilmatieteenlaitos.fi/wave-height. The graphs also have a wave height forecast for the same point. The same page also shows all the latest observations from the buoys, including the highest single wave and sea temperature.
The similar graphs can be seen on the Marine Weather. The observation history for a longer time period can be found in the Open data and the Download observations -services on a table or in a machine-readable format.