
Weather services: Updates and production
You can find the weather forecast for around 17,000 localities in Finland on the Local weather webpage. Also foreign locations are included. The page contains location-specific warnings, sunrise and sunset times, as well as the length of the day, weather observations, weather radar (precipitation) and lightning location network data, as well as various weather data on the Finnish map.
The Finnish Meteorological Institute's web service contains dozens of different weather products. The updating schedules and production methods of these products are described in more detail on these pages. Many products are marked with an update time. In part of the product descriptions also the updating schedules are specified. However, the Finnish Meteorological Institute cannot guarantee that the information will be updated within the specified timetable.
Local weather: Weather forecast for FinlandLocal weather: International weatherWarningsPast WeatherRadar image and lightning observationsSunrise, sunset and daily lengthLocal weather: Weather forecast for Finland
Location selection
You can find the weather forecast for around 17,000 localities in Finland on the Local weather webpage. In addition to all of Finland's municipalities, the list also includes villages and districts. On the Local weather page, you can also check the weather forecast for thousands of foreign locations.
Using text prediction, you only need to give the first letters of the place name and then pick the interesting weather forecast on the list of suggestions. The place names are from the GeoNames database, which is updated by the users.

You can also check the weather forecast by locating. At the top of the page, on the left side of the search column, you can find the locate-tab. Locating works for mobile use, but may not be successful when using your computer.
The weather forecast is not dependent on the nearest weather observation station. For example, if you select Kotka from the Local weather menu, you will see a forecast for the centre of Kotka rather than a forecast for the offshore Kotka Rankki observation station, even though the nearest observation station to Kotka is situated at sea.
Wind readings do not necessarily depict sea conditions, even if a marine location is selected. The Local weather forecast applies to inland weather. Marine weather forecasts can be found in the Marine weather and Baltic Sea section, which also contains information for lake districts.
The weather forecast is given for the place stated in the Local weather heading. Temperatures, weather symbols, and wind speed and direction depict the forecast situation at a given time.
5 days forecast
First the forecast is given every 3 hours, thereafter, the forecast is given every six hours, at 03, 09, 15 and 21 (local time) and the rest of the forecast is given every 12 hours at 03 and 15.
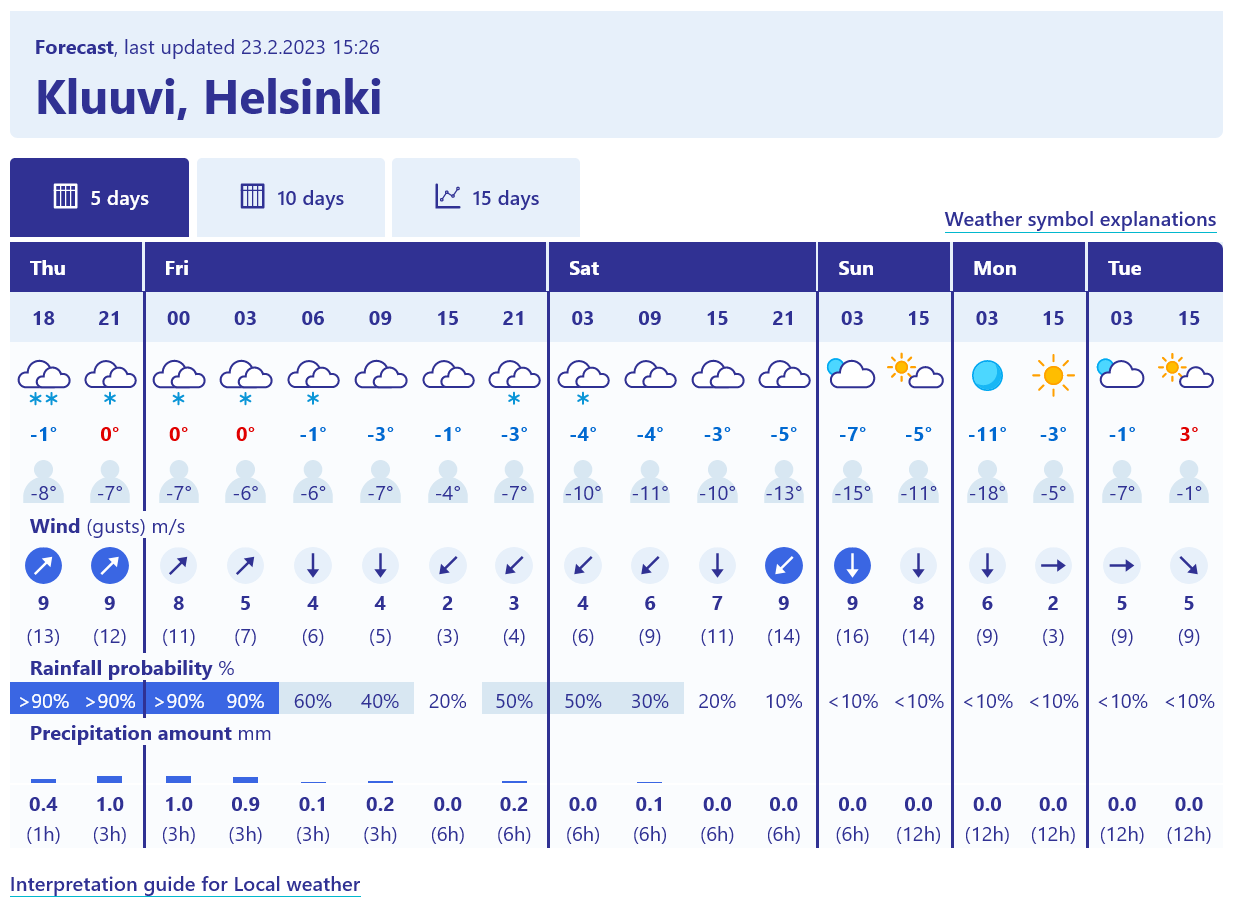
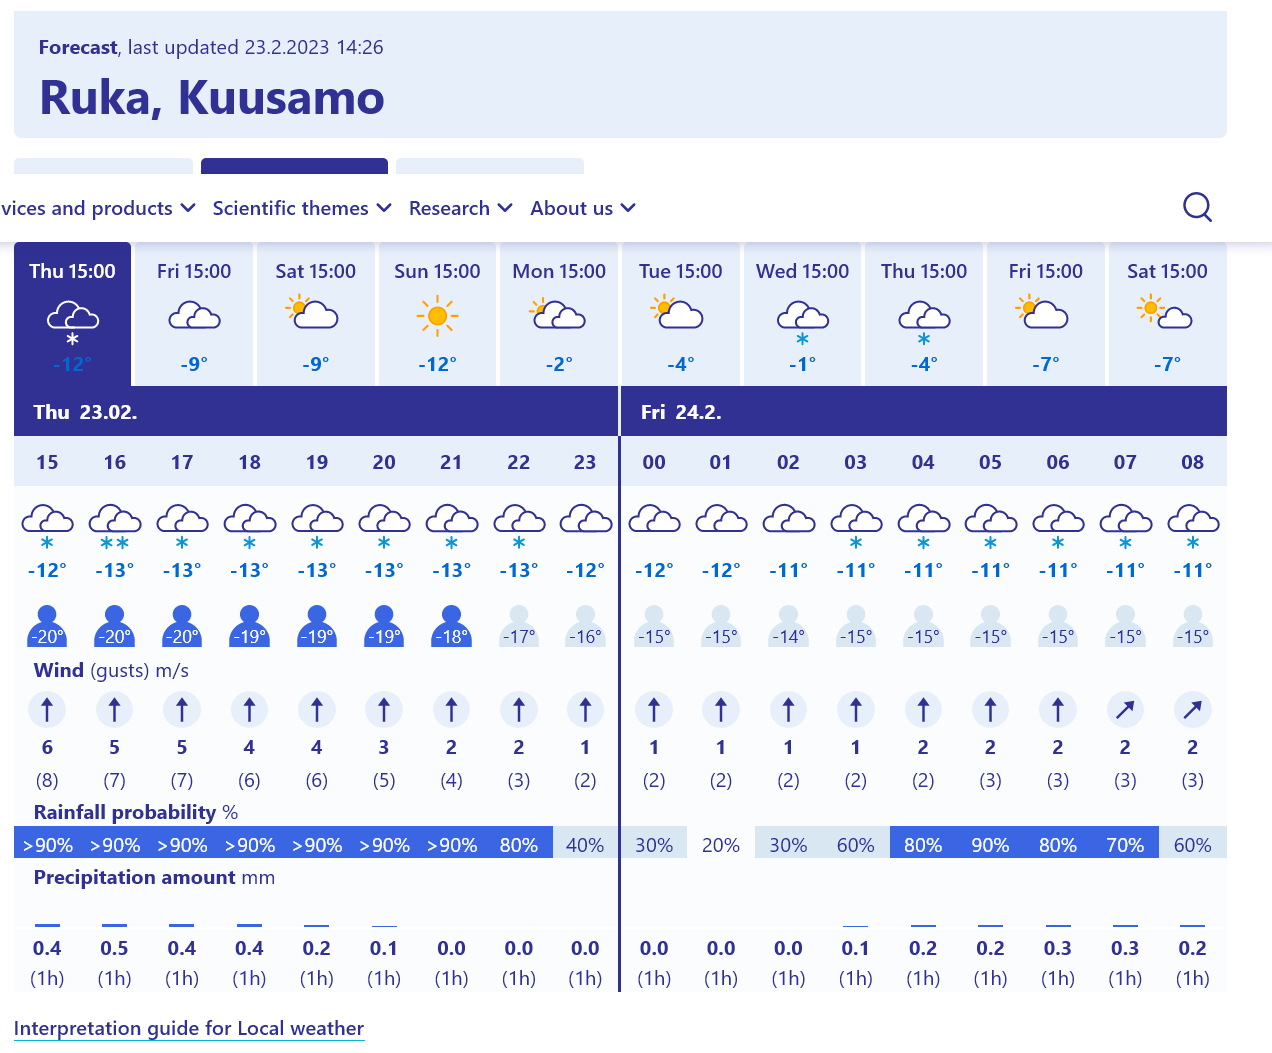
Table weather forecast for the next few hours and for 10 days
Forecast for the next 18 hours and then every 3 hours 9-10 days forward. Click a day to get a daily forecast. The weather symbol at the day indicates the weather at 15:00, not the whole day.
Forecast contents
Weather symbol. The moon symbol is used during the night when the sun is below the horizon. See the verbal explanation of the weather symbols used in FMI web service.
Temperature. Plus degrees in red and minus degrees in blue. In sub-zero temperatures, a minus sign is included.
The weather feels like. The temperature shown inside the figure considers the effect of wind, humidity, and sunshine on the perceived temperature. If the 'feels like' temperature is at least 5 degrees colder than the forecast temperature, the figure will be blue. If the 'feels like' temperature is at least 2 degrees warmer than the forecast temperature, the figure will be pink.
Wind speed and direction. The point of the arrow shows the direction in which the wind is headed. For instance, in the figure’s the first time period, there is northern wind. The upper wind readings are the wind speed average for 10 minutes. The wind gust reading is in brackets. Sometimes the difference is considerable, or even double. Wind warnings for land areas are given about wind gusts. More information on wind issues can be found in the thematic information section.
Probability of precipitation for the hour preceding the forecast time, in percentages. For instance, a value for 12:00 refers to precipitation between 11:00 - 12:00. The probability of precipitation applies to precipitation of minimum 0.1 millimetres.
The amount of precipitation accumulated between the forecast time and the preceding forecast time. The length of the period is indicated in brackets. Snowfall is given as snow water equivalent.
Forecasts are updated several times every day. The nearest hours are updated more frequently than the last 24 hours.
15 days probability forecast A forecast spanning several days is often more uncertain than the forecast for the next day. In the 15-day forecast, temperature and precipitation quantities are also depicted using a probability forecast produced by the physical weather forecast model. Statistical corrections might have been made to the probabilistic forecasts to better correspond to the observed uncertainty.
Additional information about the image can be obtained by hovering your cursor over the relevant time period (not available in mobile version). The additional information section provides the meteorologist's forecast, as well as, the probability distribution of the weather forecast model, with 80 percent probability. The Meteorologist's forecast spans approximately 10 days ahead.
The temperature scale is on the left-hand side of the graph and the precipitation scale is on the right. Temperatures are measured in whole degrees and precipitation to an accuracy of one tenth.
You can turn the quantities on or off by clicking on a quantity name at the bottom of the image.
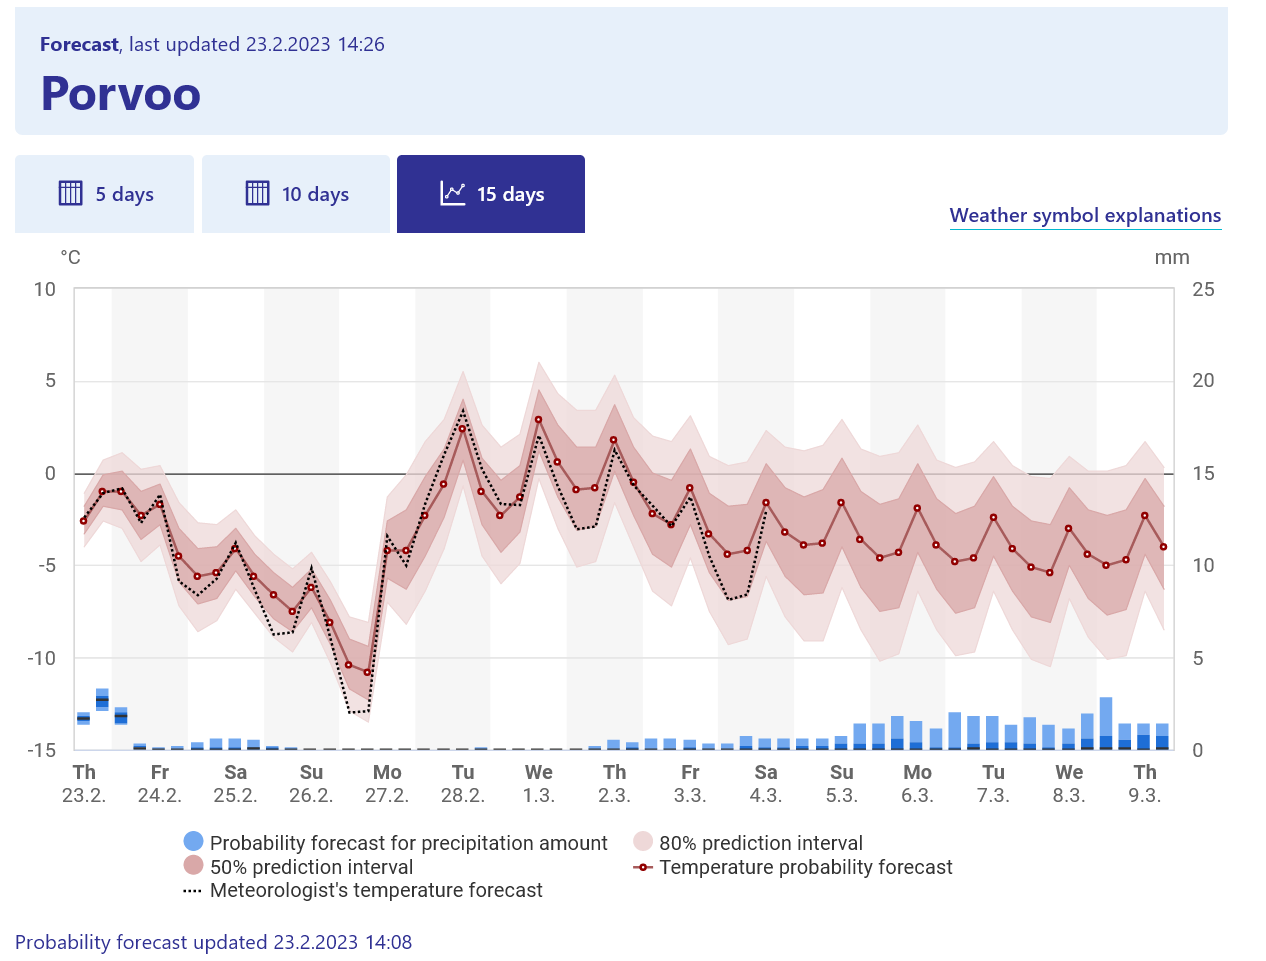
Temperatures are depicted with red bands
The red line is used to mark the median of forecasts produced by the weather model.
The probability of the temperature in the inner red area is 50 percent.
The area marked in lighter red is the area in which the probability of the temperature is 80 percent.
20 percent of cases do not fit in the forecast distribution.
If the distribution is wide, weather predictability is poor and should only be considered indicative.
Precipitation is depicted using blue bars
The black horizontal line depicts the median of the precipitation forecast produced by the weather model.
In the dark blue bar area, the quantity of precipitation is 50 percent probable.
The precipitation quantity in the lighter blue bar area is 80 percent probable.
The temperature given is the value at a given time. The precipitation quantity is the precipitation accumulated during the past six hours, given in millimetres.
The probability forecast is updated twice every twenty-four hours. The update time may vary depending on production factors. The update takes place one hour later in daylight saving time than in normal time, so-called winter time.
The probability forecast is given by the European Centre for Medium-Range Weather Forecasts (ECMWF). Statistical corrections might have been made to the probabilistic forecasts to better correspond to the observed uncertainty.
Meteorologist's forecasts
The Meteorologist's temperature forecast is marked on the graph using a black dotted line. The Meteorologist's forecast spans approximately 10 days ahead.
In particular, in coastal and other marine areas, the weather forecast generated by the weather model may deviate significantly from the weather forecast given by the meteorologist. This is also the case if the daily temperature fluctuations are high. The differences can be seen most clearly for the first couple of days. The meteorologist needs time to produce a new forecast using the new material. If the probability forecast has been updated in the last couple of hours, the Meteorologist's forecast may be based on the previous weather forecast model run and the differences may therefore be larger than usual.
Local weather: International weather
You can find weather forecasts and sunrise and sunset times for thousands of foreign locations on our local weather page.
Using text prediction, you only need to give the first letters of the place name and then pick the weather forecast interest you on the list of suggestions. The place names are from the GeoNames database, which is updated by the users. If you find any errors in the names, please notify GeoNames using the feedback form.
Local time is in use in foreign locations. The time zone is always told.
Wind gust forecast is not available in all foreign locations.
Precipitation probability forecasts are only available for the following areas adjacent to Finland:
Nordic countries (except Iceland)
Northern parts of Central Europe
Baltic states
Northern parts of Belarus
Westernmost part of Russia
15-day forecasts are available for a slightly wider area than precipitation probability forecasts. In Western Europe, the boundary lies north of the 51st parallel, while in Eastern Europe it is slightly further to the south. In Russia, the area extends east of the area for which precipitation probability forecasts are available.
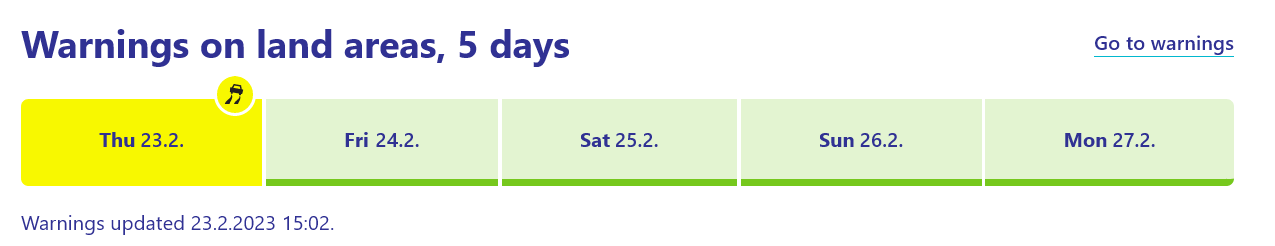
Warnings
Local weather has warnings for land areas. Warnings in sea areas are not visible even if you select a marine location.
To access the Warnings page, which shows all warnings, click a day or click "Go to Warnings". Select a day to view the Warning Map for that day directly.
Past Weather
Local weather observations are collected from the Finnish Meteorological Institute's observation stations. The name of the observation station is given in connection with the observations. The frequency of data updates varies but is usually 10 minutes.
The page shows the nearest observation station or several observation stations in the nearby area. A suitable observation station for all locations may not be found in the area of the same municipality. Whereas, in certain municipalities, there are several observation stations.
You can view and remove quantities by clicking on the name at the quantity at the bottom of the image. Weather observations are not available for foreign locations. The forecast location is not affected by observation stations.
Observation stations report:
Temperature
Atmospheric pressure
Relative humidity
Dewpoint temperature
Wind direction and direction value, as well as speed (10-minute wind speed average)
Gust value of wind (greatest 3-second average wind)
Precipitation during the past hour
Snow depth
Cloudiness
Visibility
The reported observation quantities vary by station depending on the data measured at the station. Only the daily precipitation quantity is reported by precipitation stations.
Cloudiness codes are converted to text as follows: 0/8 clear sky 1/8–2/8 almost clear 3/8–5/8 partly cloudy 6/8–7/8 almost cloudy 8/8 cloudy 9/8 means that the amount of clouds cannot be determined, for example, due to dense fog or heavy snowfall.
Observation curves The observation curves are updated as frequently as the observation data in text format. The information displayed in the observation curves varies depending on the data measured at the observation station. Some stations only have daily values.
Click the arrow icon at the bottom of the chart to move backwards and forwards in the time.
You can click on the names of weather variables at the top of the chart to remove and redisplay different weather variables.
The weather variable contains temperature, dewpoint temperature and precipitation during the past hour.
The wind variable contains average wind speed (10-minute average), the biggest wind gust value for 10 minutes and the direction of the wind. The arrow indicates the direction of the wind. For example, a northerly wind blows from the north and the arrow points downwards. Correspondingly, an easterly wind blows from the east and the arrow tip points to the left.
The snow depth is measured daily at 8 a.m. (At 9:00 in daylight saving time).
Shift values are received at 8 am (at 9 am in daylight saving time). The temperatures include the minimum, maximum, and grass minimum temperature over the past 24 hours, and precipitation during that time (converted to water). In addition, there is the grass minimum temperature that depicts frost.
More information on making weather observations at the Finnish Meteorological Institute.
Radar image and lightning observations
Local weather shows the weather radar observations (precipitation data) from the last hour as an animation updated at 5-minute intervals. Similarly, it shows data on lightnings from the flash observation system. The image is updated every 5 minutes. The blue bar lets you choose the time. Use the arrow on the left to start and the II character to pause the animation.
Sunrise, sunset and daily length
Sunrise and sunset times are the calculated values for a specific location. Potential small differences with other sources defining sunrise and sunset times may be due to the existence of several astronomical formulas for calculating these times. In addition, differences may arise depending on the difference between the coordinate points used in the calculation.
23.2.2023