
Conversions for sea level height systems in Finland
The difference between the theoretical mean water (MW) and other height systems in different years.
The tables display the difference between mean water level (MW) and the other height systems (NN, N43, N60, N2000) for each year in various locations along the coast of Finland, measured in centimetres. The location can be selected from the dropdown menu. Data can also be downloaded as an Excel or PDF table.
The first column contains the years and they can be sorted from start to end or end to start. The earliest year is 1887, when the first tide gauge was established, and numbers are calculated also for a couple of upcoming years. The following columns represent geodetic height systems difference to the theoretical mean water in centimetres. Data can be downloaded as an Excel or PDF table from the top right corner.
Examples of height system calculations
Example 1: Convert from one height system to another.
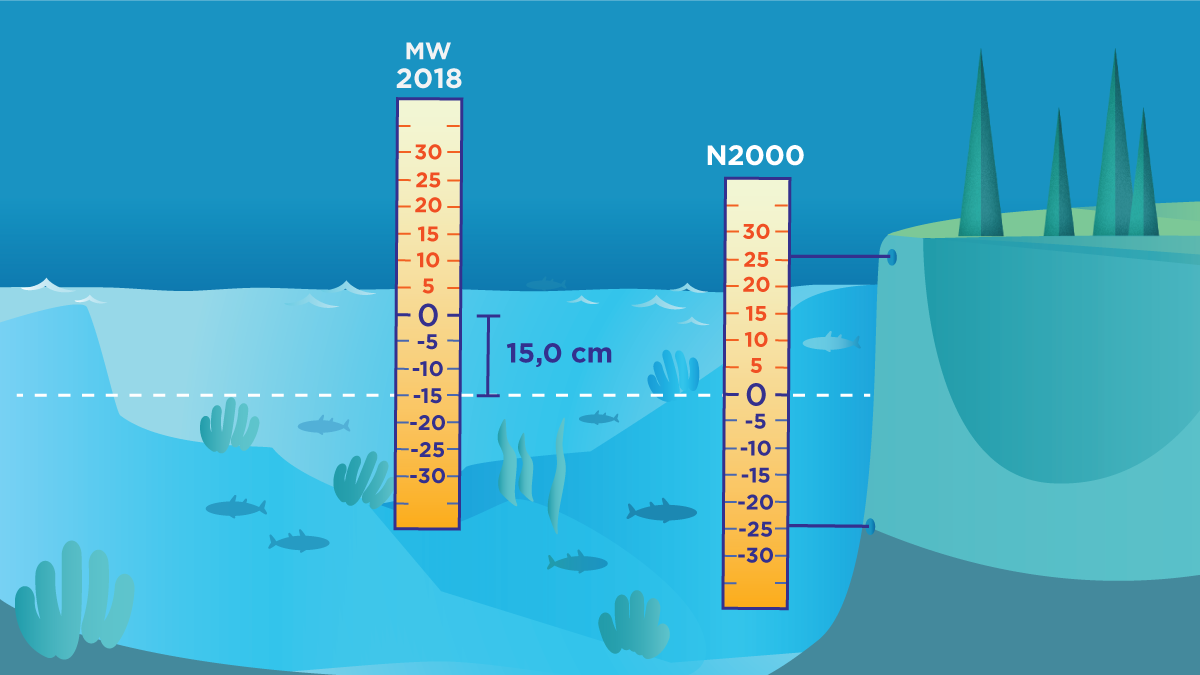
In 2018, a sea level value of +5 cm, referenced to the theoretical mean sea level, was measured at Turku. What was the sea level expressed in N2000 system? What about in the N60 system?
Answer: in N2000 In the conversion table the relation of the theoretical mean sea level 2018 to the N2000 system in Turku was 15,0 cm. Thus, the sea level in N2000-system is 5 cm + 15.0 cm = 20.0 cm
Answer: in N60 In the conversion table the relation of the theoretical mean sea level 2018 to the N60 system in Turku was -14.2 cm. Thus, the sea level in N60-system is 5 cm - 14.2 cm = -9.2 cm
Example 2: Convert certain year´s MW to another year´s MW.
In 2012, a sea level value of -22 cm, referenced to the theoretical mean sea level was measured at Pietarsaari. What is the sea level in relation to the theoretical mean sea level of 2005?
Answer by using the N2000 height system: The MW2012 zero level is 107 mm above the zero level of the N2000 system. The MW2005 zero level is 137 mm above the zero level of the N2000 system. Thus, the zero level of MW2005 is 30 mm above the zero level of MW2012. The sea level in MW2005 is -22 cm – 3.0 cm = -25.0 cm
Answer by using the N60 height system: The MW2012 zero level is 333 mm below the zero level of the N60 system. The MW2005 zero level is 303 mm below the zero level of the N60 system. Thus, the zero level of MW2005 is 30 mm above the zero level of MW2012. The sea level in MW2005 is -22 cm - 3.0 cm = -25.0 cm
Example 3: Land uplift.
How much has the land risen from the sea at Pietarsaari during 1960-2010?
Answer: The height of the theoretical mean sea level in 1960 (MW1960) in relation to the N2000 system is +46.4 cm at Pietarsaari, as obtained from the conversion table. Likewise, the height of the theoretical mean sea level in 2010 (MW2010) is +11.5 cm. Between 1960 and 2010, the land has risen 46.4 cm – 11.5 cm = 34.9 cm = 35 cm